

- Monthly visits
- 780
- 2026-09
- Monthly growth -21.1%
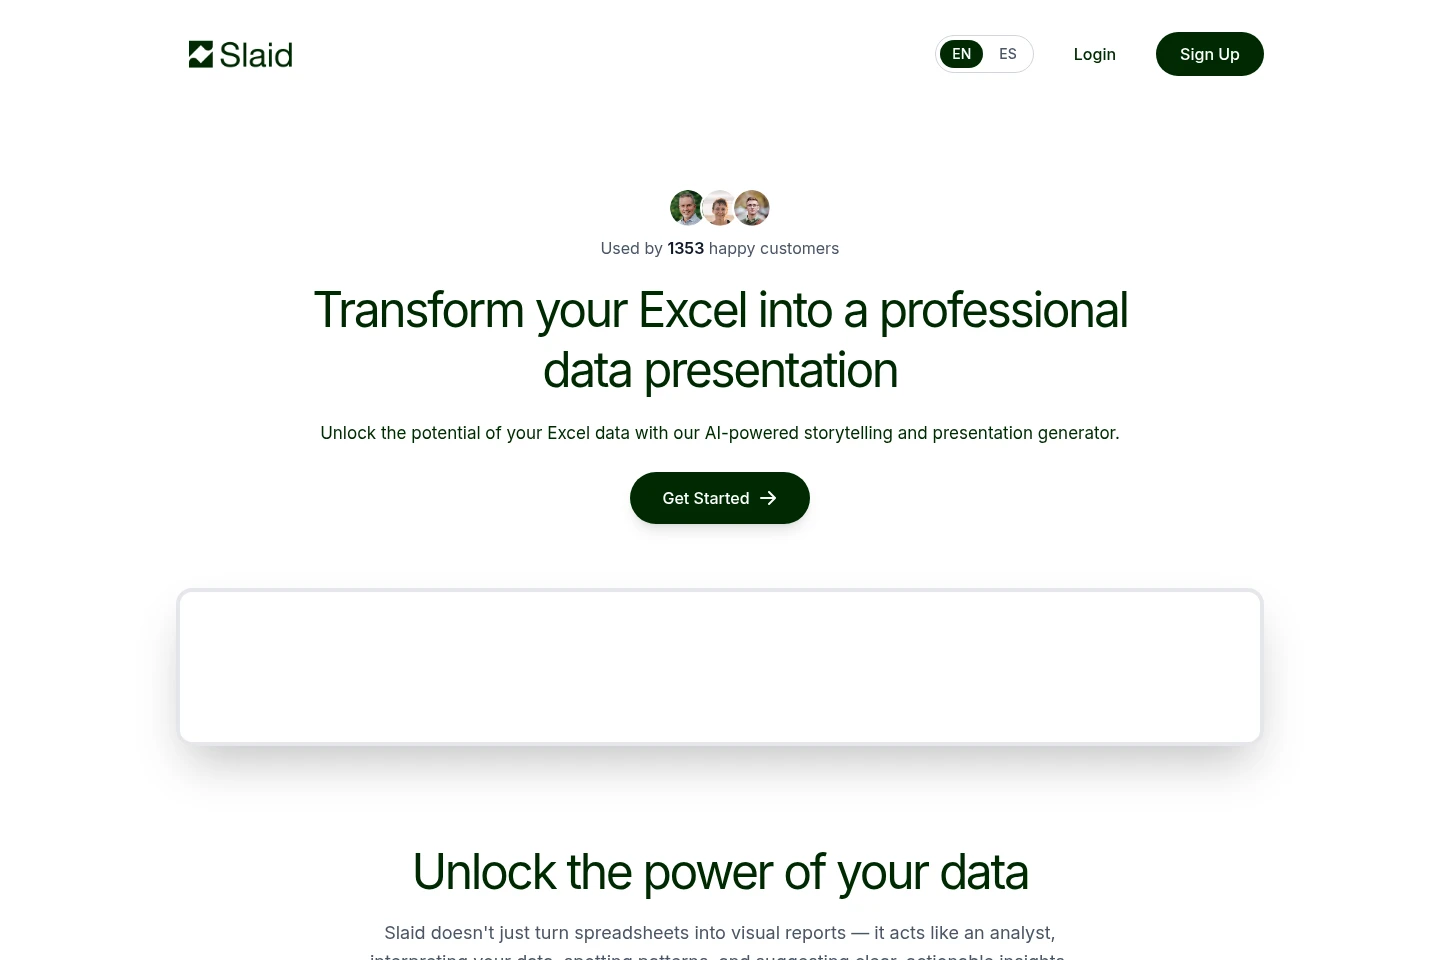
Slaid - Turn spreadsheet data into editable presentations
Slaid analyzes uploaded spreadsheets, identifies patterns and trends, and creates presentation-ready reports with charts, summaries, and key takeaways. Users can explore interactive charts before exporting a report to PowerPoint, where the text remains editable. Supported spreadsheet formats include XLSX, XLS, and CSV.
- AI Data Tools
- Data Analysis
- Data Visualization
- Presentation Makers
- Excel presentation generator
- AI spreadsheet analysis
- PowerPoint data reports
Capabilities
AI spreadsheet analysis
Analyzes uploaded spreadsheet data and identifies patterns, trends, key metrics, and anomalies. Upload an XLSX, XLS, or CSV file; the service analyzes its structure without requiring formulas or pivot tables.
Presentation-ready reports
Turns spreadsheet analysis into a structured presentation with titles, charts, summaries, and key takeaways. The report is laid out for clarity and can be exported for editing.
Interactive chart exploration
Lets users click through charts, explore data, and highlight relevant information. Charts can be examined and visuals adapted before the report is exported.
PowerPoint export
Exports reports to PowerPoint for further editing. Text remains editable in the exported presentation; charts are preserved as high-quality images.
Pricing
The supplied page does not establish paid plan prices or billing terms. Compare credit allowances and presentation-size limits on the current pricing page before choosing a plan.
Use cases
Analyze spreadsheet trends and anomalies
When a spreadsheet contains figures that need interpretation, upload an XLSX, XLS, or CSV file for Slaid to analyze. It identifies patterns, trends, key metrics, and anomalies without requiring manual formulas or pivot tables.
Create a presentation from spreadsheet data
When spreadsheet findings need to be presented, use Slaid to generate a report with titles, charts, summaries, and key takeaways. The resulting presentation can be exported to PowerPoint for further editing.
Explore and adapt charts before export
When reviewing visualizations of spreadsheet data, click and explore interactive charts to examine the numbers and highlight relevant details. Adapt the visuals before exporting the report.
Limitations
The stated upload formats are XLSX, XLS, and CSV; other spreadsheet file formats are not listed as supported.
Charts exported to PowerPoint are preserved as high-quality images, rather than as editable charts.
Credit use varies with presentation size; the FAQ says five-slide presentations use fewer credits than presentations of 15 or more slides.
Who it is for
People who need to turn spreadsheet data into presentation-ready reports
Analysts who want AI to identify spreadsheet patterns and key metrics
Presentation creators who need editable PowerPoint reports from spreadsheet data
FAQ
Which spreadsheet file formats can Slaid analyze?
Slaid lists XLSX, XLS, and CSV as supported upload formats. Google Sheets files can be used if exported as XLSX.
Can I edit a presentation after generating it?
Yes. Export it to PowerPoint to edit the presentation; text remains editable, while charts are preserved as high-quality images.
How does Slaid analyze spreadsheet data?
Slaid analyzes an uploaded spreadsheet to identify its structure, key metrics, patterns, trends, and insights. The page says this does not require manual setup, formulas, or pivot tables.
How many credits does a presentation use?
Credit use depends on the number of slides: the FAQ says a five-slide presentation uses fewer credits than one with 15 or more slides. The homepage gives inconsistent new-user credit amounts, so it does not establish a single amount.
How does Slaid handle uploaded data?
The FAQ says data is encrypted in transit and at rest, is not shared with third parties, and remains under the user's ownership. Users can delete their data from account settings.
Comments