

- Monthly visits
- 6,148
- 2026-09
- Monthly growth +52.3%
Maple - OpenTelemetry observability for traces, logs, metrics and incidents
Maple is an OpenTelemetry observability platform for collecting and investigating traces, logs, metrics, errors, and browser sessions. It links signals to help teams follow requests and investigate incidents, with alerting, uptime monitoring, and an MCP endpoint for querying observability data. Use Maple as a hosted service or run Maple Local on your laptop; a self-hosted server is also available.
- LLM Developer Tools
- LLM Observability
- Uptime Monitoring
- MCP Servers
- Software
- OpenTelemetry observability
- distributed trace monitoring
- logs metrics alerting

Capabilities
Signal collection and exploration
Collects and displays traces, structured logs, metrics, and browser sessions, linking related signals for investigation. Send telemetry through OpenTelemetry Protocol (OTLP); filter logs by severity, service, or attributes and open related traces.
Error tracking
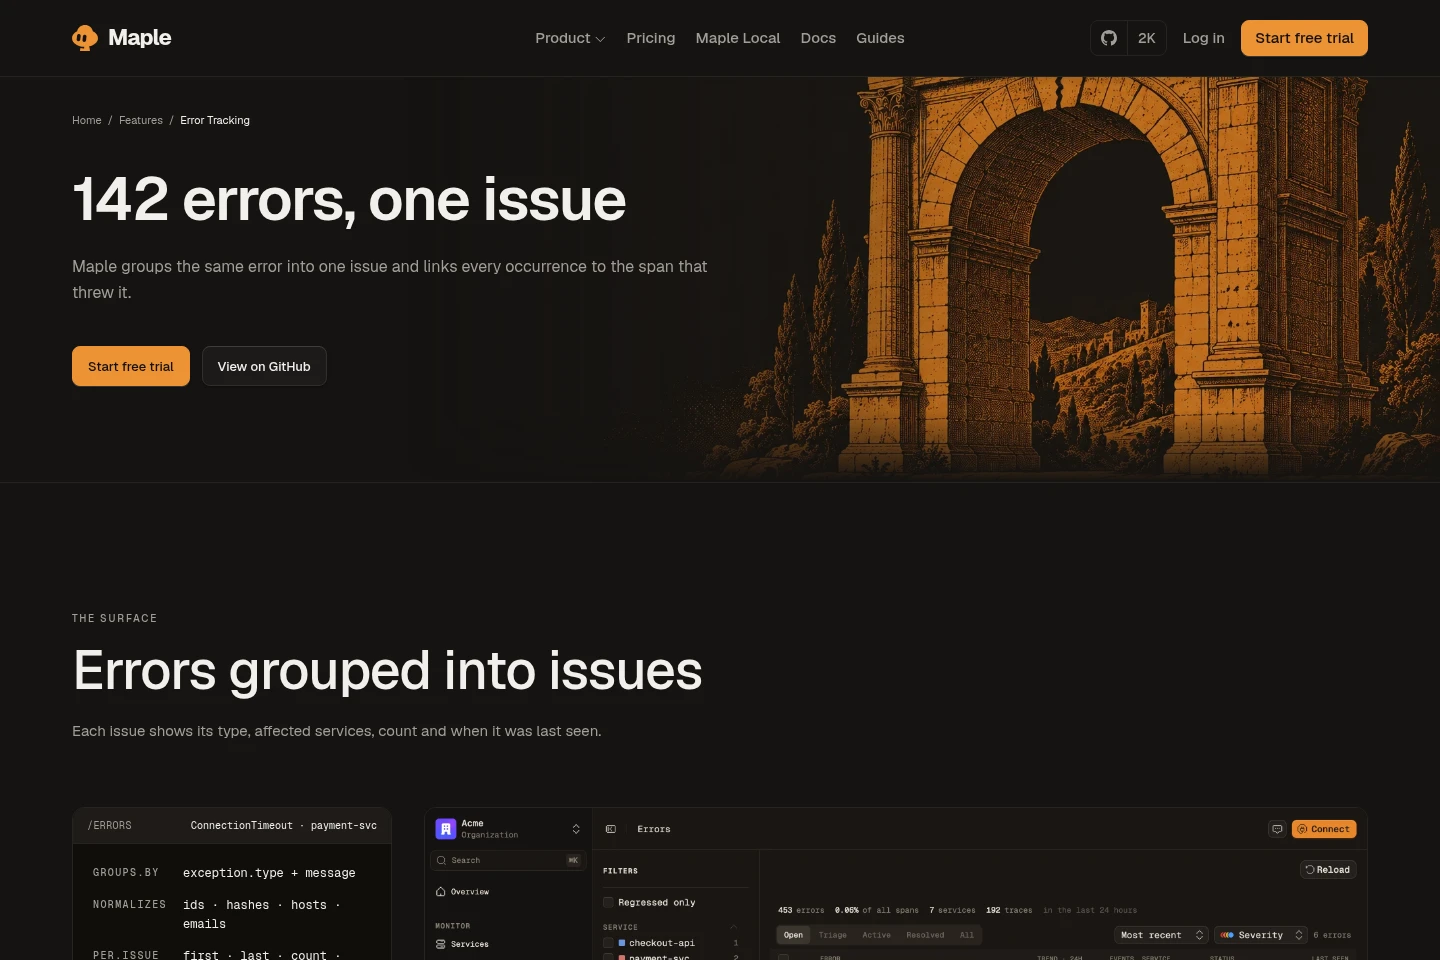
Groups related exceptions into issues and links occurrences to their originating spans and traces. Maple normalizes identifiers, hosts, and emails for matching; issues show affected services and counts, and users can claim issues, add notes, and set severity.
Alerting and incident routing
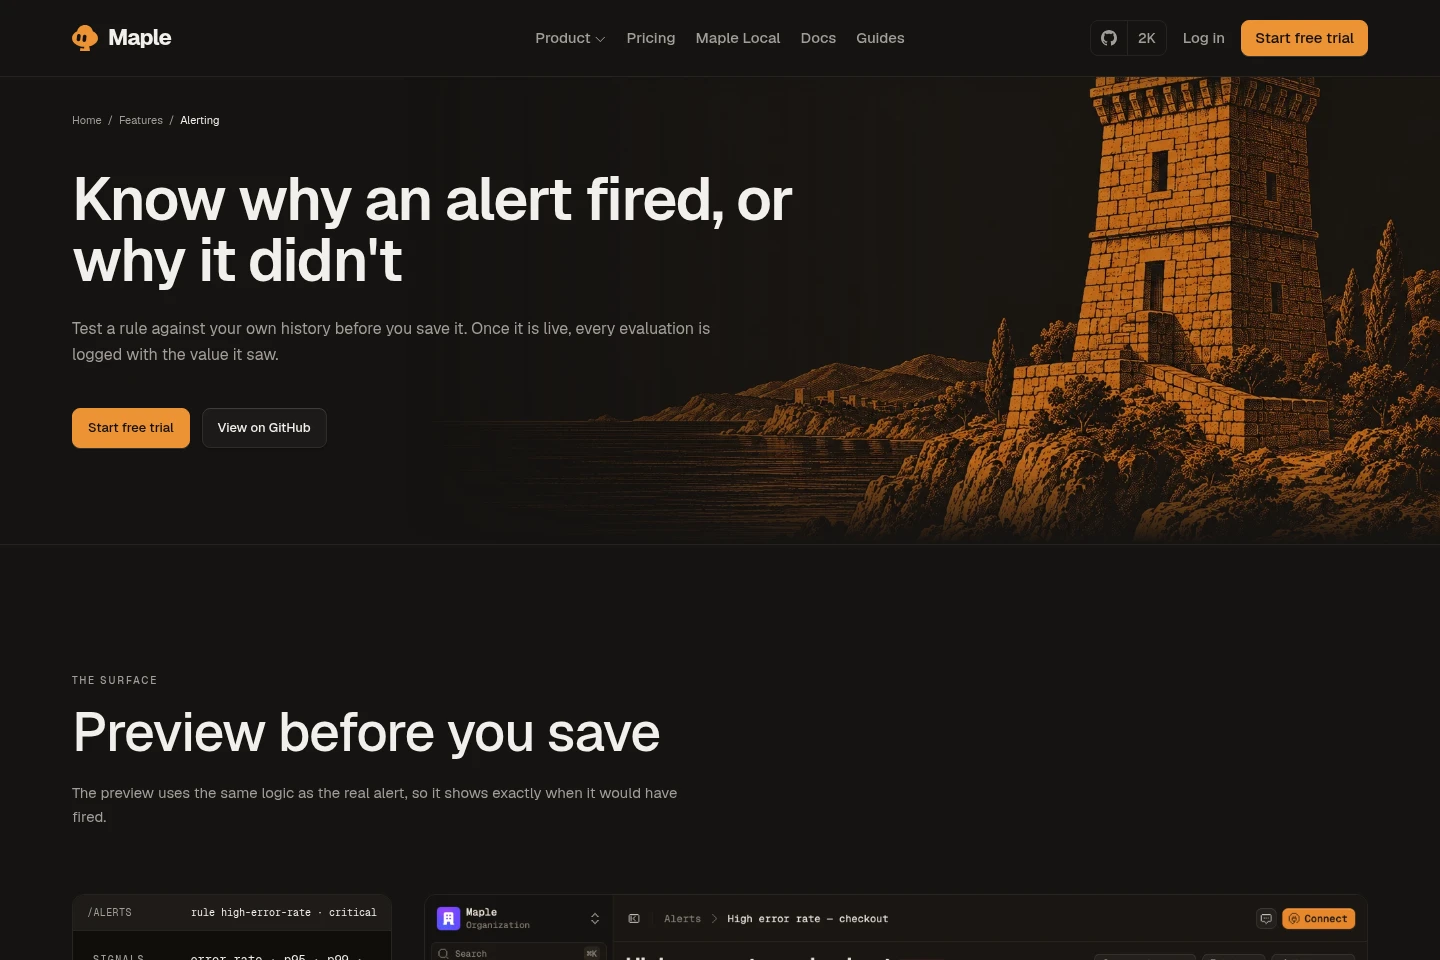
Evaluates threshold rules and sends notifications to configured destinations. Rules can use built-in signals, queries, or raw SQL; preview them against history, group by service or attributes, and route incidents to channels including email, chat services, or webhooks.
Service and infrastructure monitoring
Shows service request flows and metrics, and connects Kubernetes telemetry with services and spans. Kubernetes support uses a Helm chart; connected cloud and data providers can supply metrics, logs, and deploy information.
MCP observability access
Lets MCP-compatible clients query Maple observability data and inspect services. The MCP endpoint supports Streamable HTTP with API keys or OAuth; clients can list services, search traces, and read source information.
Local collector and dashboard
Runs OTLP ingestion, a query API, an embedded database, and a dashboard locally in one Maple executable. Install with Homebrew or the supplied shell command; local mode needs no account or cloud connection.
Pricing
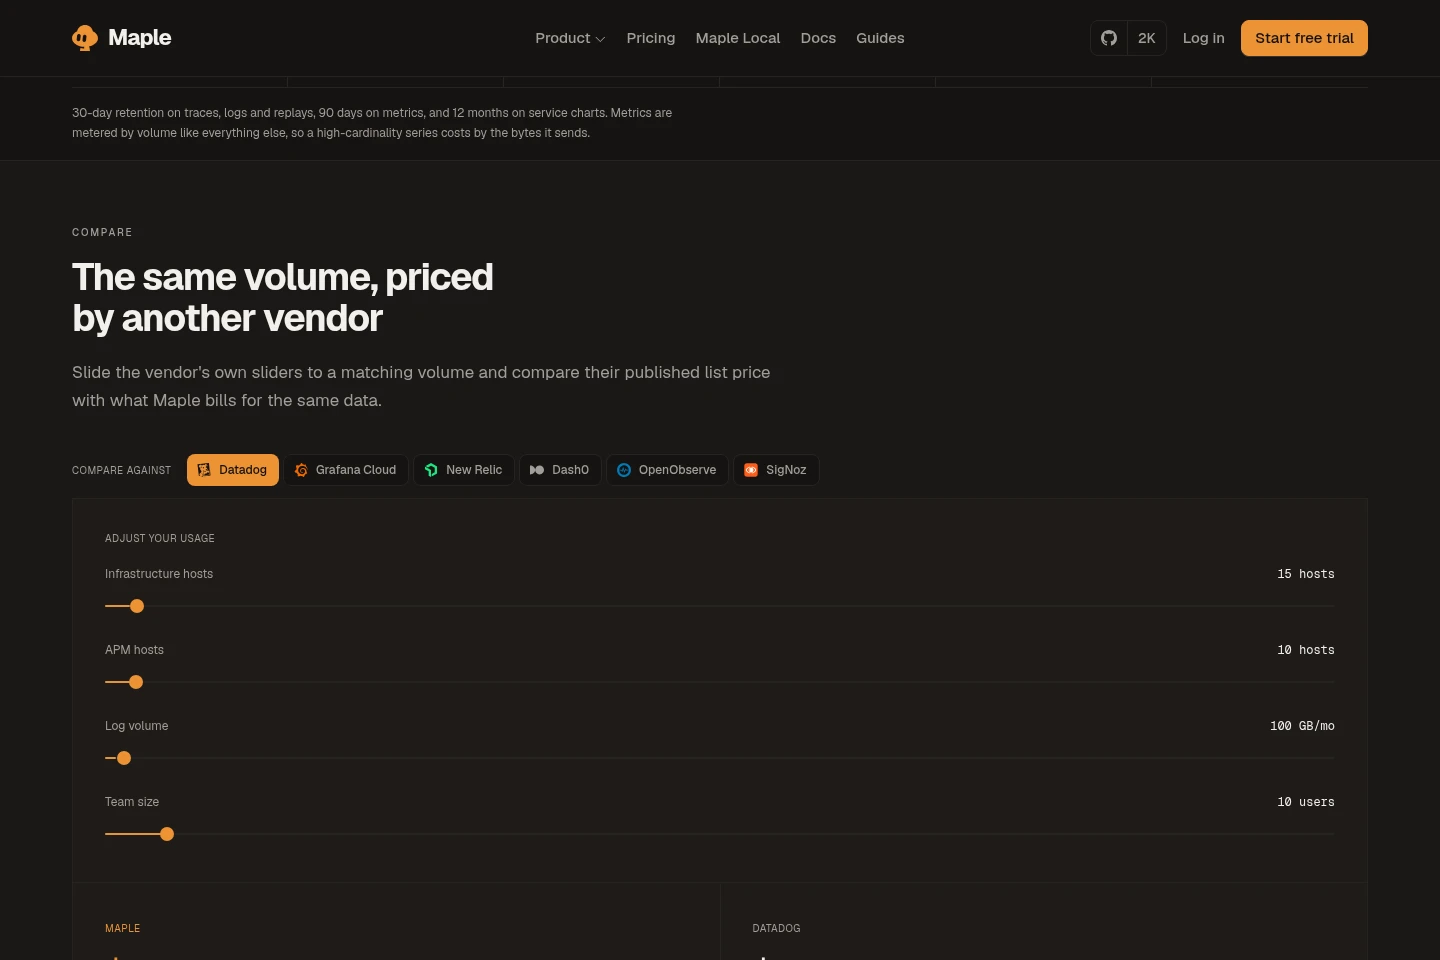
Maple offers a recurring paid Startup subscription with a 14-day trial, plus an Enterprise option with custom terms. Compare included signal volumes, session and event allowances, retention, and overage rates when choosing.
| Plan | Price | Included features and limits |
|---|---|---|
| Startup | $39 per month |
|
| Enterprise | Contact for pricing |
|
Choose a data region when creating an organization: US or EU hosting has the same plan and rates. In the EU, telemetry is stored and processed in Frankfurt. Startup says there are no per-seat, per-host, or per-query fees.
Use cases
Investigate a slow or failing request
When a request is slow or returns an error, follow its trace through the services it touched. Inspect spans and attributes, open correlated logs, and use the linked signals to locate the failing part of the request.
Triage and route an observability incident
When a monitored signal crosses a threshold, preview and save an alert rule, then route resulting incidents to a team destination. Maple evaluates rules every minute, logs checks, and can group incidents by service or another attribute.
Run observability data on a laptop
When telemetry needs to be inspected locally without an account or cloud, start Maple Local as a single executable. It receives OTLP data, stores it in an embedded database, and provides a local query API and dashboard.
Limitations
The self-hosted version runs for one team; alerting and team accounts are available on Cloud for now.
The Startup trial lasts 14 days and requires a payment card to start; billing begins after the trial unless canceled.
Startup includes 100 GB each for logs, traces, and metrics; additional volume is billed at $0.30 per GB per signal.
The Enterprise plan is described as higher volume, custom retention, and priority support, with purchase details provided through a founder contact.
Who it is for
Software teams investigating service performance and production errors
Platform and SRE engineers monitoring OpenTelemetry and Kubernetes systems
Developers who need a local telemetry collector and dashboard
FAQ
How much does the Startup plan cost?
Startup costs $39 per month and includes 100 GB each of logs, traces, and metrics. Additional signal volume costs $0.30 per GB; the plan also includes specified session, event, and AI usage allowances.
Does Maple offer a free trial?
Yes. Startup has a 14-day free trial, and a payment card is required to start it. The pricing page says you can cancel anytime and that nothing is charged until the trial ends.
Can Maple be self-hosted?
Yes. Maple can run on your infrastructure, and Maple Local runs on a laptop as one executable without an account or cloud. The self-hosted version is for one team; alerting and team accounts are currently on Cloud.
Which telemetry can Maple receive?
Maple accepts OpenTelemetry Protocol data, including traces, logs, and metrics, and supports browser sessions. The pricing page describes 30-day retention for traces, logs, and replays, 90 days for metrics, and 12 months for service charts.
Does Maple provide an API or webhooks?
The Startup plan includes full API access, and alert rules can route to a webhook. The listed webhook destination is for alert delivery; the pages do not describe incoming webhooks.
Comments