
Visual Infograph AI Dash - AI transforms data into infographics
"Data visualization is the new storytelling. In a world drowning in information, Visual Infograph AI Dash emerges as your lifeboat—turning raw data into visual masterpieces that don't just inform, but captivate."
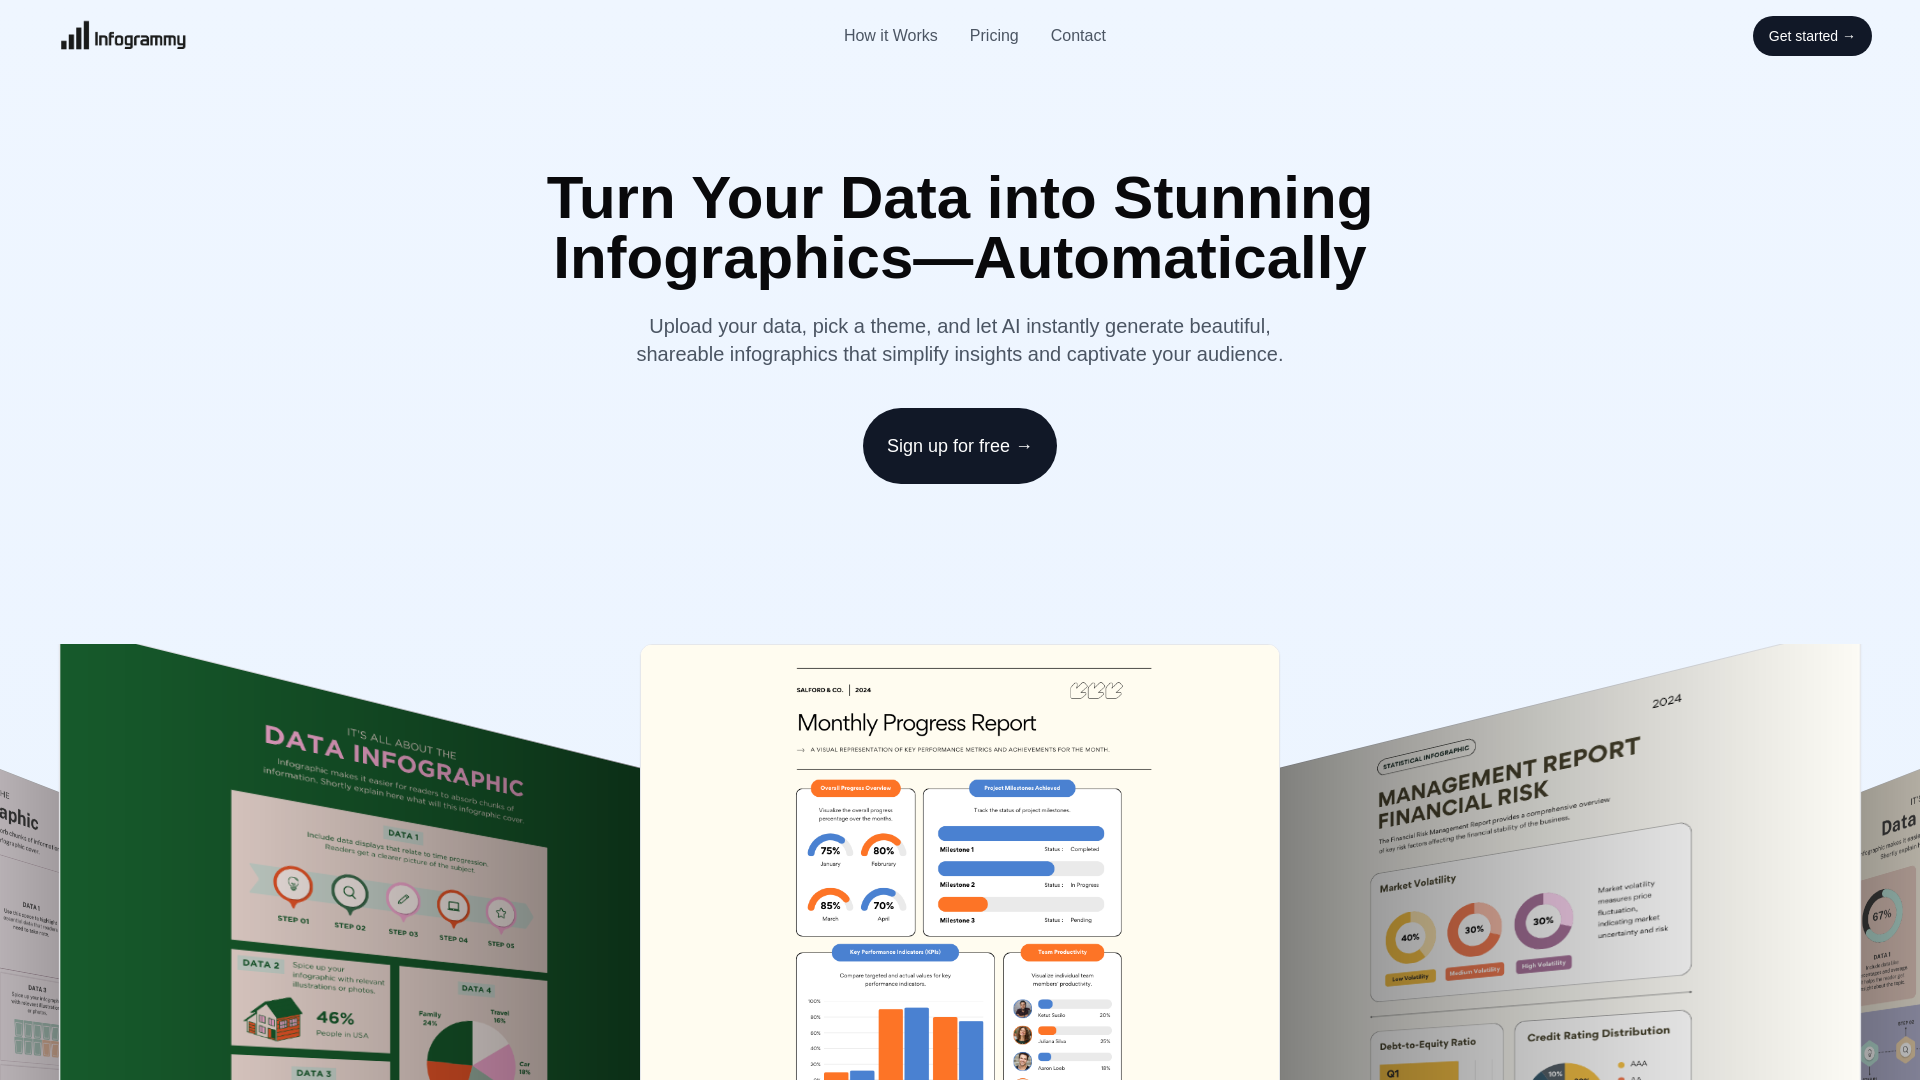
Let's face it—we're all suffering from data overload. Every marketer, designer, and business owner knows the pain of staring at spreadsheets, willing the numbers to magically transform into something people actually want to look at. That's where Visual Infograph AI Dash changes the game.
The AI Infographic Revolution: Why It Matters Now
We're living in the golden age of visual content. Consider these eye-opening stats:
- Infographics are 30x more likely to be read than text articles (Venngage)
- 65% of people are visual learners (Social Science Research Network)
- AI-generated visuals save up to 8 hours per project compared to manual design (Piktochart 2024)
But here's the catch—traditional infographic design requires:
- Design skills most of us don't have
- Hours of tedious formatting
- Constant tweaking to get it "just right"
How Visual Infograph AI Dash Works (In Plain English)
1. Dump Your Data—Any Format Works
📊 CSV, Excel, PDF—even copy-pasted text. The AI doesn't discriminate.
2. Pick Your Visual Personality
🎨 Choose from professionally designed templates that automatically adapt to:
- Your industry
- Data type
- Brand colors (yes, it's that smart)
3. Let the AI Work Its Magic
⚡ In seconds, you get:
- Clean, readable layouts
- Smart data visualizations (it knows when to use pie vs bar charts)
- Share-ready formats for all platforms
Why Marketers Are Switching to AI Infographic Tools
Having tested dozens of solutions, here's what makes Visual Infograph AI Dash stand out:
🔹 True Time Savings
No more wrestling with design tools. What used to take hours now takes minutes.
🔹 Data Accuracy
The AI cross-checks your numbers, flagging potential errors human eyes might miss.
🔹 Storytelling Intelligence
It doesn't just visualize—it structures your data into a compelling narrative flow.
"I used to outsource all our infographics until we found this. Now we produce 3x more visual content at 1/4 the cost."
—Actual user review from Reddit's r/Infographics community
Pricing That Makes Sense (No Hidden Gotchas)
| Plan | Price | Best For | Key Perks |
|---|---|---|---|
| Basic | $15/mo | Testing the waters | 30 credits |
| Premium | $25/mo | Serious creators | 55 credits (with bonus) |
| Enterprise | $50/mo | Teams & agencies | 115 credits (with bonus) |
Pro Tip: Each credit = 1 complete infographic generation or edit. Most users find Premium offers the best value.
Beyond Basics: Advanced Features Designers Love
While the AI handles the heavy lifting, creative pros appreciate:
✏️ Customization Depth
Adjust every element post-generation without losing AI optimizations
📈 Smart Data Interpretation
Automatically highlights key trends and outliers in your datasets
🌐 Multi-Platform Export
Perfectly formatted for blogs, social media, and even print materials
The Verdict: Who Needs This Tool?
✅ Content Marketers drowning in blog post data
✅ Startup Founders needing investor-ready visuals
✅ Educators making complex topics digestible
✅ Agencies serving multiple clients
✅ Anyone who's ever said "I'm not a designer, but..."
"In the attention economy, visual storytelling isn't optional—it's oxygen. Tools like Visual Infograph AI Dash level the playing field, giving small businesses the visual firepower of big agencies."
Ready to Transform Your Data?
The best way to understand is to see it in action. Watch the demo or jump right in with their risk-free Basic plan.
Remember—in 2024, data without visualization is just noise. Isn't it time your insights got the spotlight they deserve?
Features
AI-Powered Generation
Automatically analyzes and transforms data into infographics.
Multiple Data Formats
Supports PDFs, CSVs, and Excel files for easy upload.
Customizable Templates
Choose from professionally designed templates and customize colors, fonts, and layout.
Whois
| Domain | infogrammy.com |
| Creation Date | 2026-04-30 20:57:57 |
| Last Updated | 2025-04-30 20:58:03 |
| Domain Status | clienttransferprohibited, //icann.org/epp |
| Registrar | Cloudflare, Inc. |
| Registrar IANA ID | 1910 |
| Registrar URL | http://www.cloudflare.com |