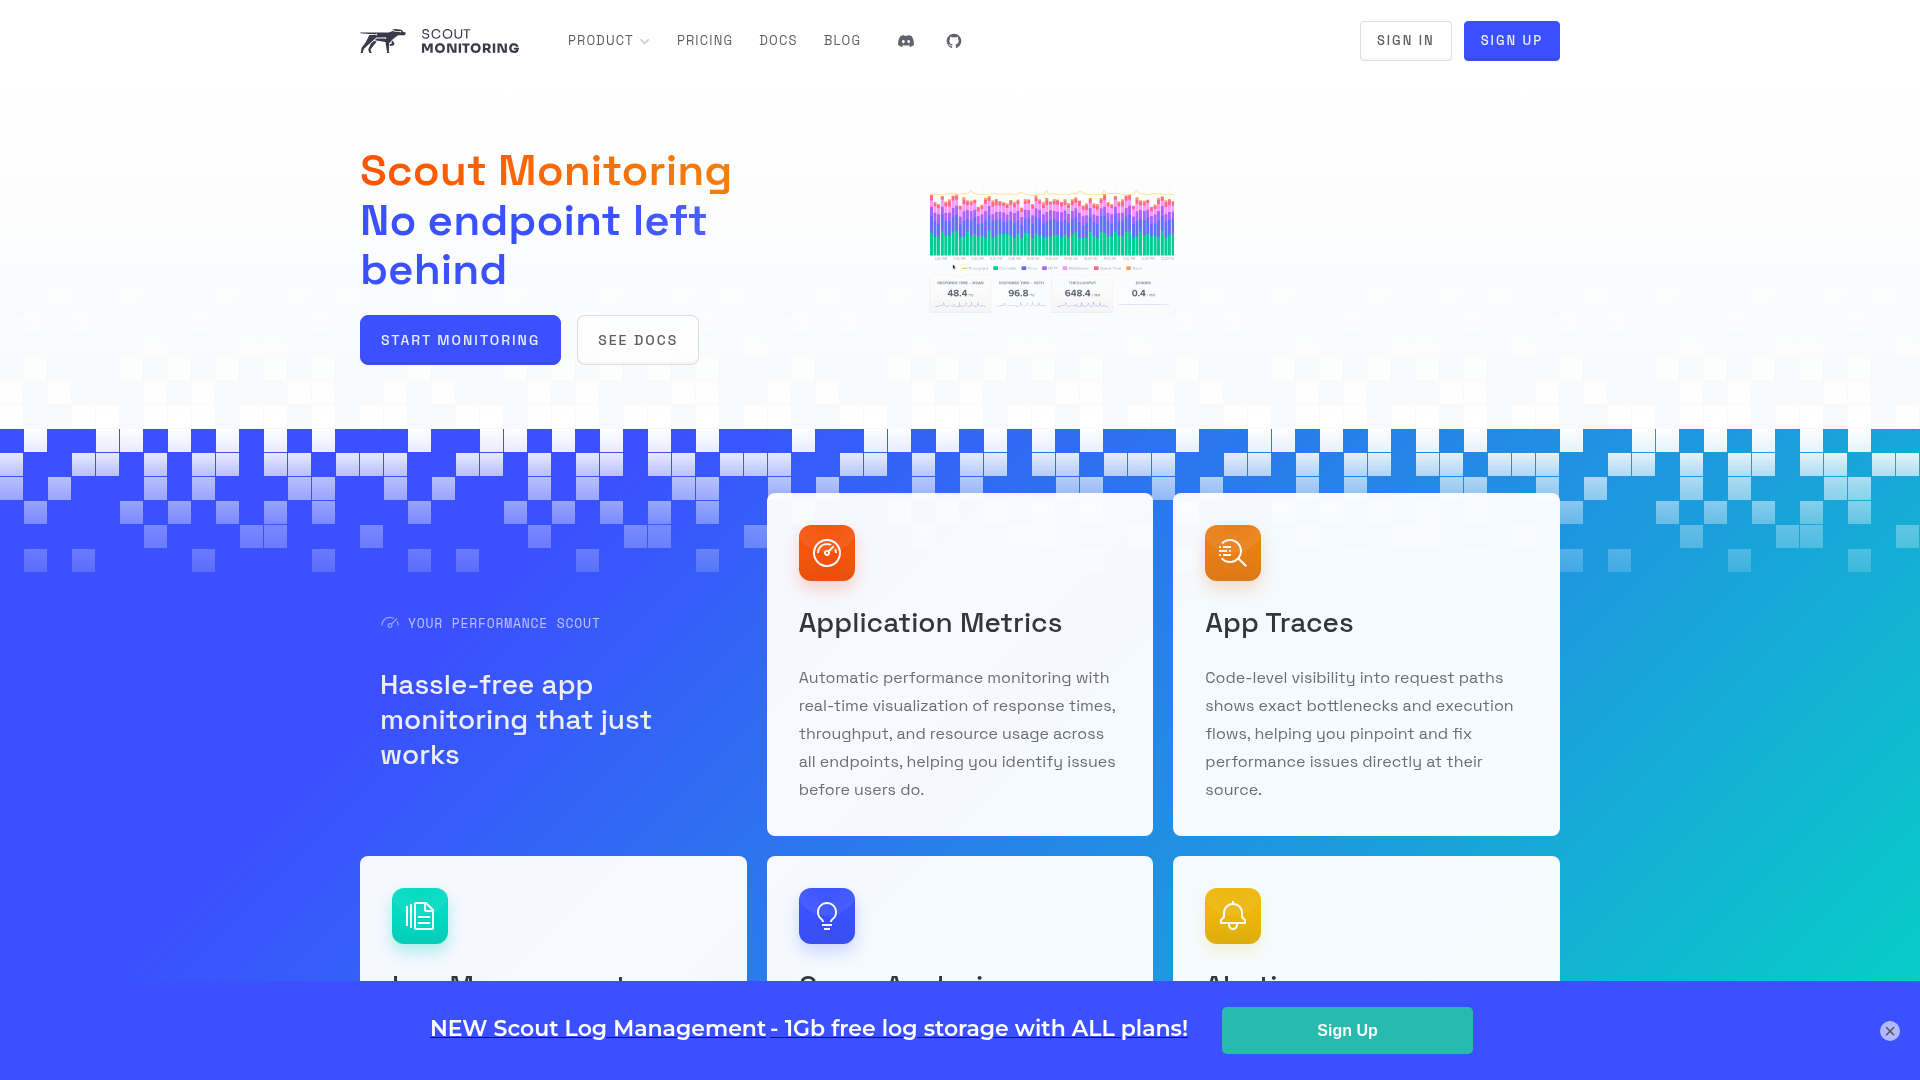
ScoutAPM - Optimize performance with ease
ScoutAPM operates by embedding lightweight agents within your application, which monitor and collect data on request performance in real-time. This process ensures that you receive actionable insights without compromising your application’s speed. Here’s how it works:
- Automatic Performance Monitoring: ScoutAPM continuously monitors metrics related to response times, throughput, and resource usage.
- Code-Level Traces: The app traces show you exactly how requests travel through your code, identifying any bottlenecks within.
- Log Management: Provides context to log data, making it easier to troubleshoot problems.
- Database Performance Analysis: It detects slow queries and N+1 issues, offering analysis on their impact.
- Custom Alerts: You easily set thresholds for alerts that notify your team of performance dips through preferred channels.
- Integration Capabilities: Seamlessly connects with popular tools like GitHub, Slack, and event systems to automate responses and track issues more efficiently.
Through these functions, ScoutAPM ensures no endpoint is left unchecked, providing clarity on your app's performance and helping you act swiftly to resolve issues, thereby maintaining user satisfaction.
To get started with ScoutAPM, follow these simple steps:
- Install the Relevant Agent: Depending on your framework (Ruby, Python, PHP, or Elixir), install the appropriate package. For example, for Ruby, add the following to your Gemfile:
gem 'scout_apm' - Run the Configuration: Next, run the command to install the dependencies:
bundle install - Configure Settings: Download your customized configuration file and place it where required (for Ruby, at
config/scout_apm.yml). Make sure to include your API key derived from your Scout account. - Deploy Your Application: Once set, deploy your app, and you should start seeing performance data in the Scout dashboard within just a few minutes.
- Monitor Performance: Use ScoutAPM's dashboard to explore metrics, traces, and logs. Customize alerts and integrate with Slack or GitHub for real-time updates on your application’s performance.
In conclusion, ScoutAPM simplifies the complexities involved in application performance monitoring. With its easy installation, powerful features, and deep integration capabilities, it empowers engineering teams to optimize their applications efficiently. By leveraging ScoutAPM, businesses can proactively enhance user experiences and ensure their applications run smoothly, leading to improved satisfaction and retention rates.
Features
Automatic Performance Monitoring
Provides real-time visualization of response times and resource usage across all app endpoints, helping identify issues before users experience them.
App Traces
Delivers code-level visibility into request paths to pinpoint exact bottlenecks and execution flows, allowing for direct remediation of performance issues.
Log Management
Ensures a unified view of logs with performance context, enhancing the troubleshooting experience across your entire application stack.
Query Analysis
Automatically detects and analyzes slow queries and N+1 problems, helping track database performance issues before they impact end-users.
Custom Alerts
Facilitates setting custom notification thresholds through preferred communication channels to keep the team informed of performance status.
Integration with Popular Tools
Easily integrates with tools such as GitHub and Slack for seamless deploy tracking and real-time alerting.
Use Cases
Web Application Monitoring
ScoutAPM is essential for web developers and IT operations teams to monitor and optimize web applications, ensuring they perform reliably and efficiently under various loads.
Performance Optimization
Software engineers use ScoutAPM to identify performance bottlenecks and optimize code to enhance overall application speed and user experience.
Database Optimization
DevOps engineers leverage ScoutAPM’s query analysis to uncover slow database queries, allowing DBAs to optimize their queries and improve application performance.
Incident Response
Support teams utilize ScoutAPM to respond quickly to performance incidents by assessing logs and metrics in real-time to maintain uptime.
Application Deployment Monitoring
Release managers use ScoutAPM to track performance post-deployment, ensuring that any issues introduced by new code are diagnosed swiftly.
Customer Experience Enhancement
Product owners benefit from ScoutAPM's insights to understand the performance impacts on customer experience and prioritize enhancements.
FAQs
Traffic(2025-03)
Monthly Traffic
Traffic Source
Top Keywords
| Keyword | Traffic | Volume | CPC |
|---|---|---|---|
| scout apm | 1196 | 1140 | - |
| what does cpu load mean 0.05 | 427 | 40 | - |
| python protobuf bytesizelong | 356 | 10 | - |
| migrate python 2 to 3 | 328 | 70 | - |
| scoutapm | 309 | 630 | - |
Source Region
Whois
| Domain | www.scoutapm.com |
Featured Products
ExplodingTopics
Atlas
Bolt.New
Scribewave
EndorsedAi
LastMileAI
Napkin
TubeBuddy
Related Categories
Copy embed code
Alternative Products


Mailgo

Recallify

Prism

Blobfish AI

Helpedby AI

Outerspan


Play Ace