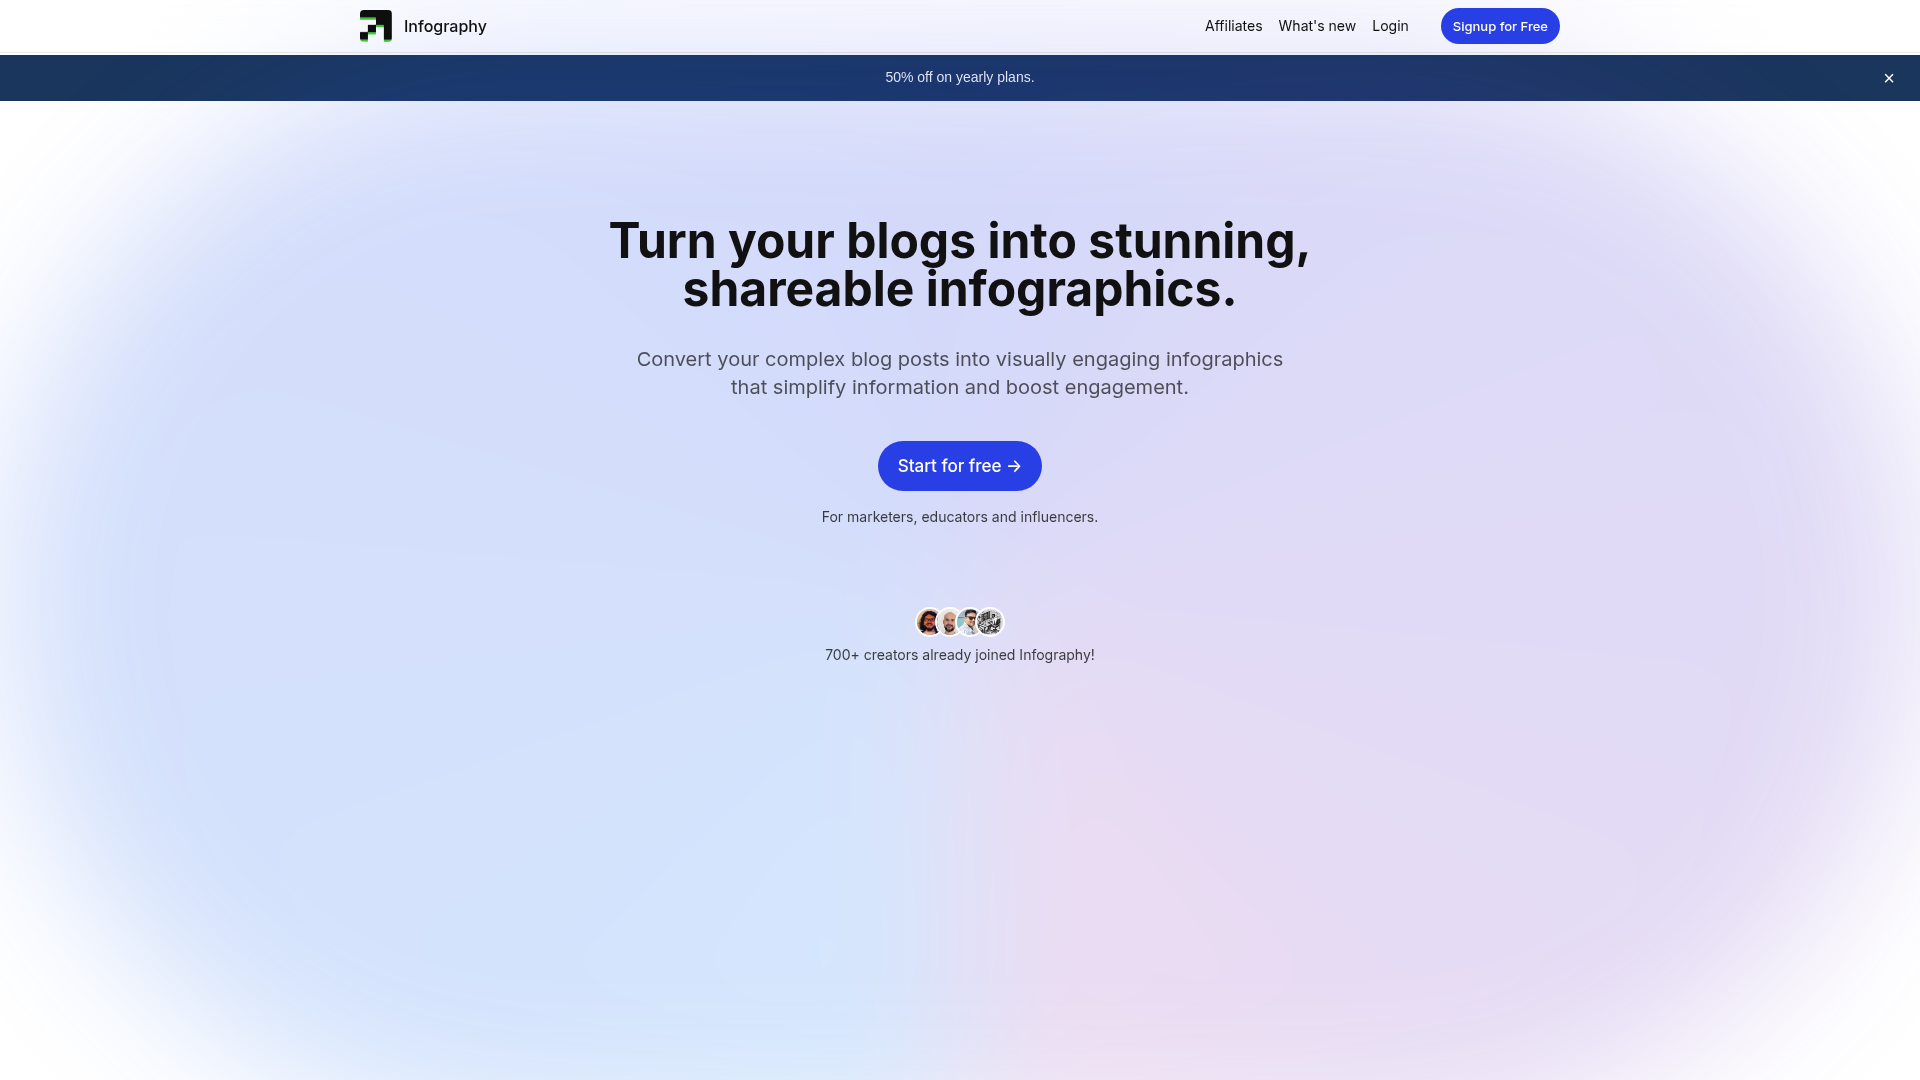
Infography - Transform your content into engaging visuals effortlessly
Infography utilizes advanced AI technology to convert textual content into visually appealing infographics. By analyzing the structure and key points of your blog post, the tool intelligently selects relevant visuals, icons, and layouts to enhance comprehension. Users can customize designs further, ensuring that the final product aligns with their branding and messaging goals. This process not only improves user engagement but also facilitates information retention by presenting data in a visually digestible format. Additionally, by embedding these infographics on your website, you can effectively boost your SEO by attracting more organic traffic and encouraging social sharing.
To create an infographic with Infography, simply sign up for an account. Choose a blog post or topic you want to visualize. Use the intuitive editor to customize your infographic by selecting colors, icons, and layouts that suit your needs. Once you're satisfied with your design, download the infographic or share it directly on social media. It's that easy to enhance your content strategy!
Infography is your go-to solution for transforming complex blog content into visually stunning infographics. With an array of features that cater to marketers, educators, and influencers, you can enhance engagement, improve SEO, and repurpose existing content effortlessly. Join over 700 satisfied creators and elevate your content strategy today!
Features
Simplify Complex Information
Infography allows you to break down complex topics into easily digestible infographics, making it perfect for statistics, tutorials, or product comparisons.
Increase Engagement and Shareability
Infographics are visually appealing and more engaging than text, leading to higher chances of being shared and remembered.
Attract Attention on Social Media
Infographics perform exceptionally well on platforms like Pinterest and Facebook, capturing attention in busy feeds.
Repurpose Existing Content
Transform your existing blog posts into infographics to extend their reach without creating new content from scratch.
Improve SEO
By embedding infographics on your website with relevant keywords, you can enhance your search engine rankings.
Customizable Templates
Easily customize text, colors, and designs to create unique infographics that match your brand.
Use Cases
Marketing Campaigns
Use Infography to create eye-catching infographics for your marketing campaigns, helping to convey information quickly and effectively.
Educational Content
Educators can utilize Infography to present complex topics in a simplified manner, making learning more engaging for students.
Social Media Promotion
Infographics can be shared on social media platforms to increase engagement and drive traffic back to your blog or website.
Blog Content Repurposing
Transform existing blog content into infographics to extend their reach and engage a broader audience without needing new content.
Product Promotion
Highlight key features and benefits of products through infographics to attract potential customers effectively.
Data Visualization
Use Infography to present statistical data and research findings visually, enhancing clarity and interest.
FAQs
Traffic(2025-03)
Monthly Traffic
Traffic Source
Top Keywords
| Keyword | Traffic | Volume | CPC |
|---|---|---|---|
| infography.in | 7290 | 6520 | - |
| infography | 4452 | 10980 | 2.69 |
| infography in | 3800 | 3180 | 0.32 |
| infographic in | 1295 | 2880 | 0.20 |
| app.infography.in | 767 | 500 | - |
Source Region
Whois
| Domain | infography.in |
| Creation Date | 2025-02-21 17:11:35 |
| Last Updated | 2024-02-26 17:11:36 |
| Domain Status | clientdeleteprohibited, clientupdateprohibited, clientrenewprohibited, clienttransferprohibited, //icann.org/epp |
| Registrar | GoDaddy.com, LLC |
| Registrar IANA ID | 146 |
| Registrar URL | www.godaddy.com |
| Registrant State | Tamil Nadu |
| Registrant Country | IN |
Featured Products
ImageTranslateAI
Atlas
Scribewave
EndorsedAi
AudioNote
Beeyond AI
Napkin
TubeBuddy
Related Categories
Copy embed code
Alternative Products

Mailgo

Frispeech

Helpedby AI

Pippit AI

Lazy Prompter

The Swarm


Maqnet AI