Graphy - Create stunning graphs effortlessly
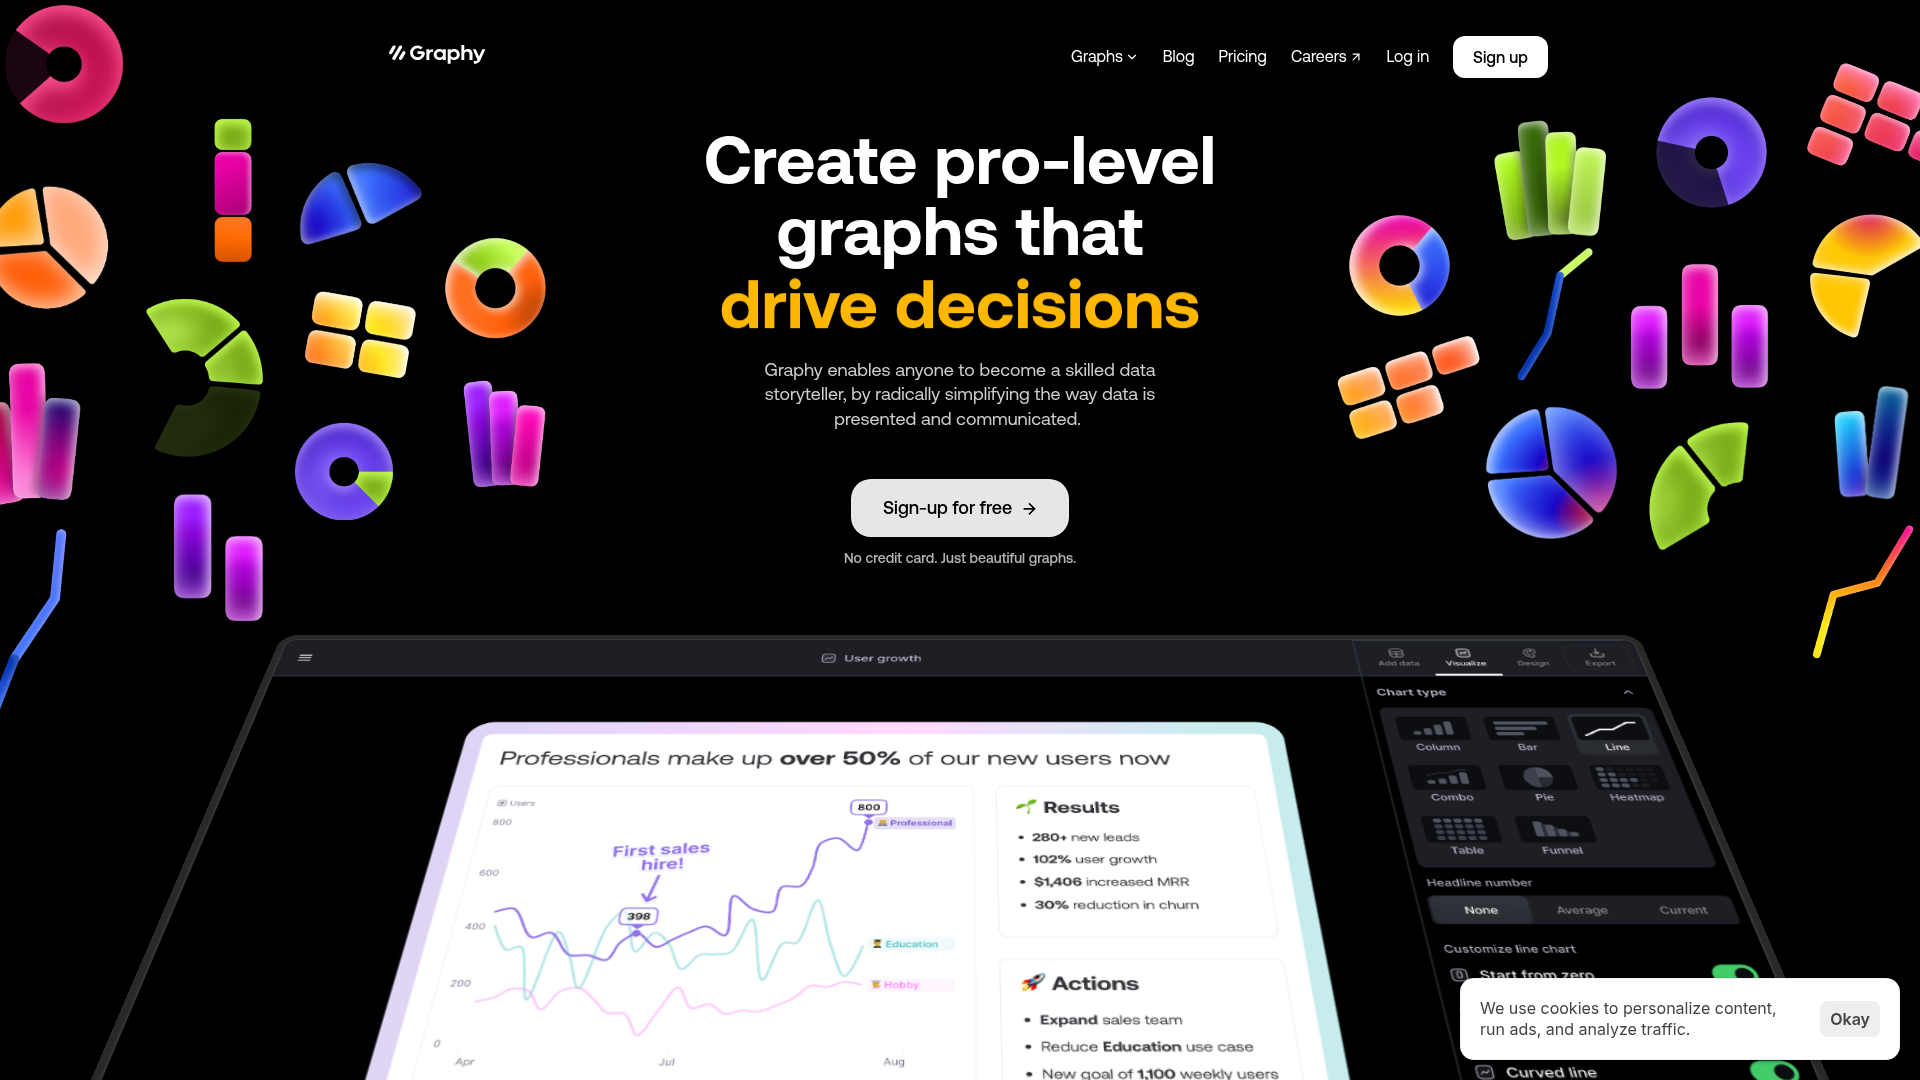
Graphy utilizes advanced AI technology to streamline the graph creation process. By simply inputting your data, the AI automatically generates visually appealing graphs while providing key insights. This innovative approach allows users to focus on what matters most: their data. Key features include:
- AI-generated charts: Quickly create graphs from your data with intelligent analysis.
- Visual storytelling: Add annotations and enhancements to highlight key points.
- Seamless sharing: Easily embed your graphs in presentations, emails, and social media.
- Integration: Connect with Google Sheets and other tools for effortless data management.
- Customization: Tailor graphs to match your brand colors and style preferences.
- User-friendly interface: No learning curve, allowing anyone to create stunning visuals with ease.
Using Graphy is simple and intuitive. Follow these steps to create your first graph:
- Sign Up: Create a free account on Graphy's website.
- Input Data: Paste your data directly or connect Google Sheets for seamless integration.
- Select Graph Type: Choose the type of graph you want to create (e.g., bar, line, pie).
- Customize: Use the customization tools to add annotations, change colors, and enhance your graph.
- Generate Insights: Let Graphy's AI analyze your data and provide key insights.
- Share: Download your graph or share it directly to your favorite platforms or tools.
In conclusion, Graphy stands out as a powerful and user-friendly solution for creating stunning graphs that drive decision-making. With its AI capabilities, customization options, and seamless sharing features, it simplifies the process of data visualization for individuals and teams alike. Whether you're a marketer, analyst, or educator, Graphy enables you to transform complex data into clear and actionable insights, ensuring your message resonates with your audience. Join the growing community of satisfied users and elevate your data storytelling today!
Features
AI-Generated Insights
Automatically generates insightful graphs and data interpretations with just a few clicks.
User-Friendly Interface
Designed for ease of use, ensuring a smooth experience for users of all skill levels.
Seamless Integration
Connects with tools like Google Sheets for effortless data import.
Custom Branding
Allows customization of graphs to reflect your brand colors and styles.
Rich Annotations
Enhance your graphs with visual notes and insights to guide your audience.
Faster than Competitors
Delivers graph creation 80% faster than other visualization tools.
Use Cases
Data Reporting
Use Graphy to create visually appealing reports that capture key insights and drive business decisions.
Presentations
Enhance your presentations with stunning graphs that clearly communicate your data story.
Social Media Marketing
Create eye-catching visuals for social media posts that engage your audience.
Collaboration
Work together in real-time to create and share graphs, fostering better team collaboration.
Educational Purposes
Leverage Graphy for educational projects, making data visualization more interactive and fun.
Stakeholder Meetings
Present data effectively to stakeholders with clear and actionable insights.
FAQs
Traffic(2025-04)
Monthly Traffic
Traffic Source
Top Keywords
| Keyword | Traffic | Volume | CPC |
|---|---|---|---|
| graphy | 7965 | 36630 | 1.14 |
| graphy ai | 1472 | 1100 | - |
| graphy app | 377 | 2300 | - |
| map heatmap generator | 311 | 30 | - |
| heatmap online | 298 | 1030 | 4.71 |
Source Region
Whois
| Domain | graphy.app |
| Creation Date | 2025-07-12 22:51:34 |
| Last Updated | 2024-07-03 02:22:54 |
| Domain Status | clientdeleteprohibited, clienttransferprohibited, //icann.org/epp |
| Registrar | Squarespace Domains II LLC. |
| Registrar IANA ID | 895 |
| Registrar URL | domains.squarespace.com |
| Registrant Organization | Graphy Technologies Ltd |
| Registrant Country | GB |
Featured Products
ExplodingTopics
ImageTranslateAI
Atlas
Scribewave
EndorsedAi
AudioNote
LastMileAI
Napkin
Related Categories
Copy embed code
Alternative Products

Shorts Generator AI


Bocca


Ai-Douse

Promptaa

OnRanko

korl.co-q8OnmaGzKo

ReelMind