Columns Ai - Transform data into stunning narratives
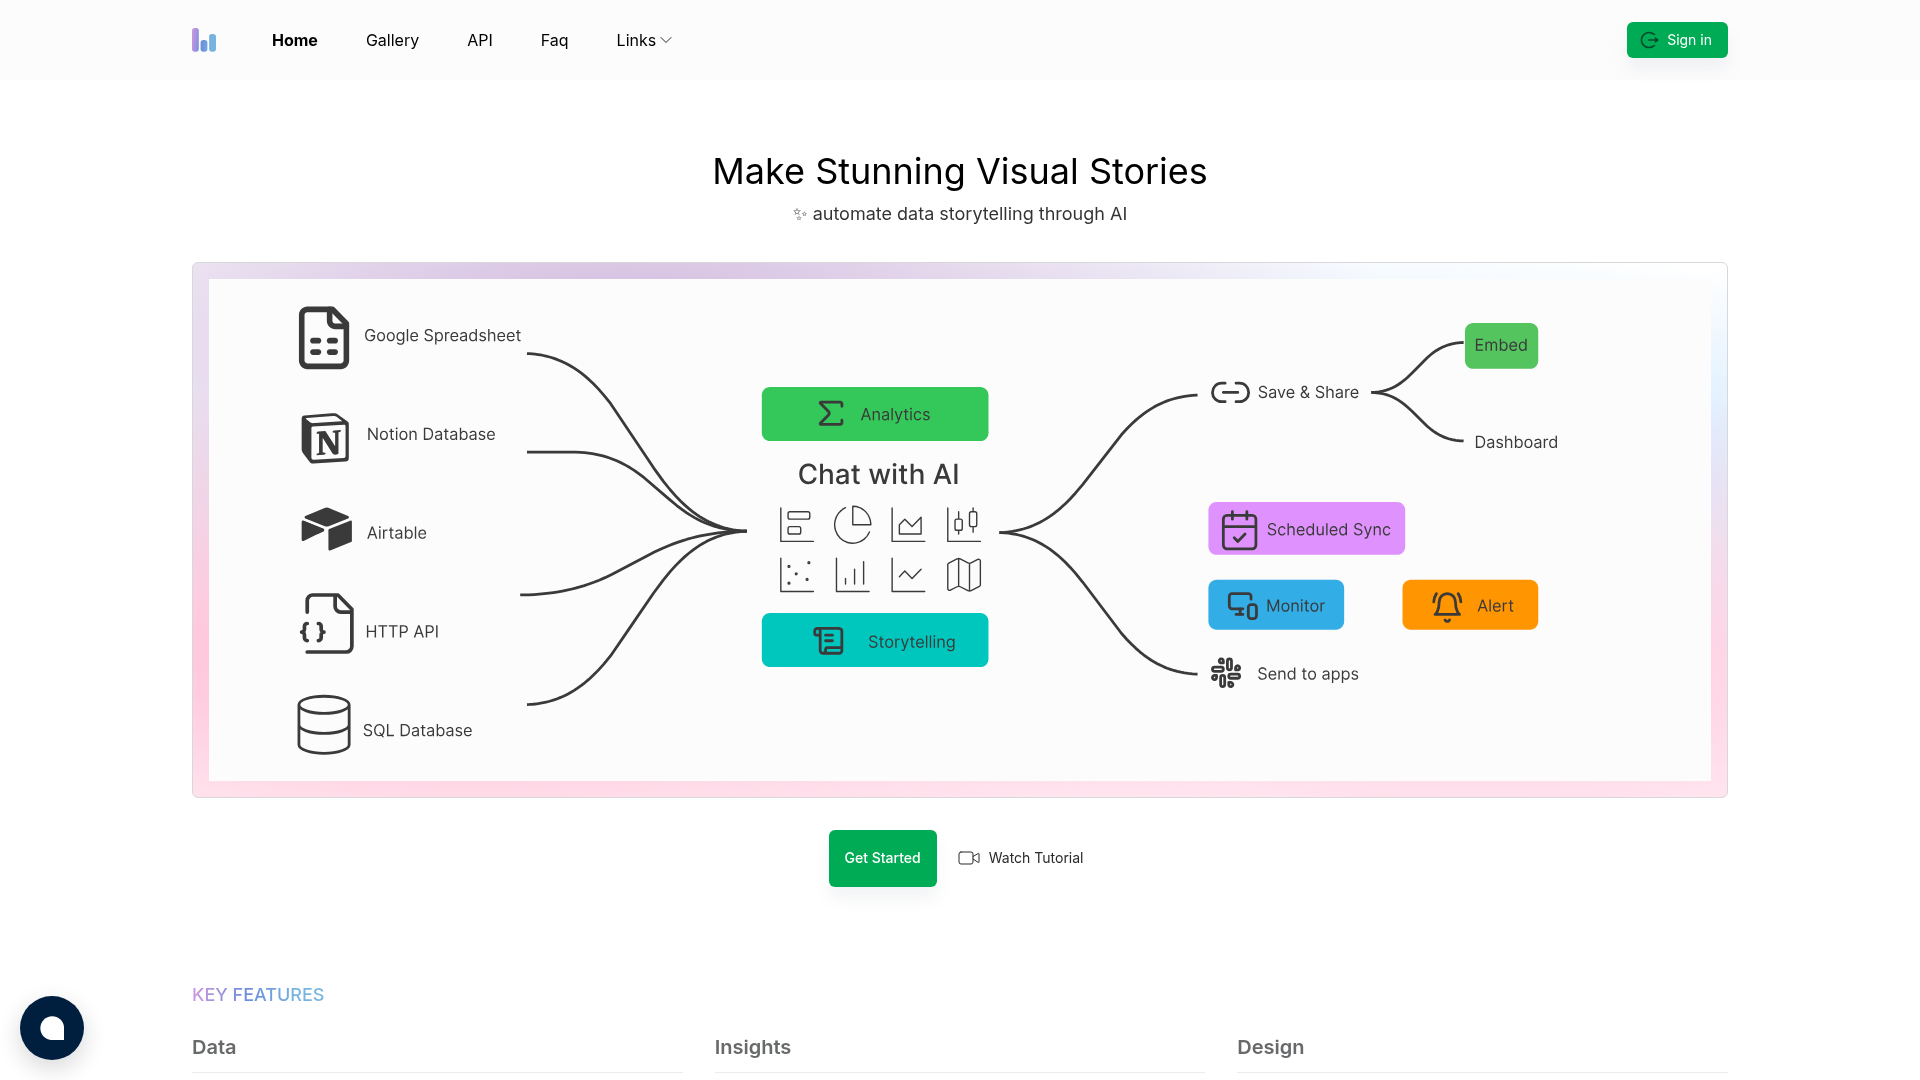

The core functionality of Columns Ai revolves around its robust AI-driven capabilities for data storytelling and visualization.
- Data Integration: Effortlessly connect to popular platforms such as Google Sheets, Notion, Airtable, and SQL databases to bring in your data.
- AI Transformation: Utilize artificial intelligence to transform your raw data into compelling visual narratives, ensuring that the story behind the numbers is effectively conveyed.
- User-Friendly Design Tools: Build stunning visuals using tools akin to Canva, allowing users to create captivating content easily.
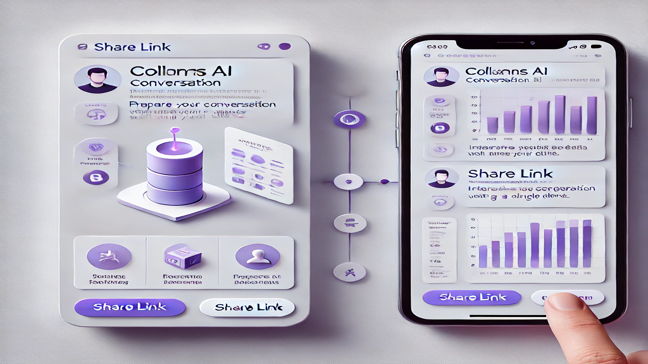
- Dynamic Sharing and Exporting: Share your visual stories through links, embed them in websites, or export them as SVG/PNG, providing multiple options for audience engagement.
- Automated Updates: Schedule automatic data updates to keep your visual stories in sync with real-time data changes.
- Template Replication: Save time by replicating graph templates and creating new visualizations with up-to-date data effortlessly.
- API Integration: Empower developers with API access to integrate Columns Ai functionality into other applications.
- Secure Data Sharing: Control data visibility and sharing settings, ensuring the privacy and security of your information while collaborating with teams and clients.
Using Columns Ai is simple yet powerful, allowing you to maximize your data storytelling potential. The process unfolds in several steps:
- Connect Your Data: Start by integrating your preferred data sources, such as Google Sheets or SQL databases. Simply log in and select the datasets you want to work with.
- Transform Your Data: Leverage AI tools to interpret and visualize your data effortlessly. Use transformation features to create beautiful, engaging visuals that highlight key insights.
- Design Your Story: Utilize Columns Ai’s user-friendly design tools to craft visually appealing presentations. Add elements like shapes, colors, annotations, and animations to enhance storytelling.
- Share and Collaborate: When your story is complete, utilize one-click sharing options to distribute your narrative through Slack, Notion, or secure links. This feature ensures your audience can easily access and explore your data.
- Update Automatically: Set scheduled updates to keep your stories current without having to manually rework visuals. This feature saves time and maintains accuracy.
- Control Sharing Settings: Easily manage your data sharing options. Generate secure links, and decide who can interact with your visuals, ensuring data privacy and control.
By following these steps, you can transform your data storytelling efforts into a seamless, engaging, and productive process that resonates with your audience.
In conclusion, Columns Ai is designed to redefine the way you present data. By integrating AI technology into the data storytelling process, it not only simplifies the creation of compelling visual narratives but also enhances collaboration and sharing among team members and clients. With features like automated updates, multiple data source integrations, and secure sharing capabilities, Columns Ai emerges as an invaluable tool for professionals seeking impactful ways to showcase their data. Embrace the future of data storytelling with Columns Ai and elevate your communication efforts today.
Features
Data Integration
Connect effortlessly to various data sources including Google Sheets, Notion, and SQL databases.
AI Data Transformation
Transform your data into compelling narratives with the help of advanced AI algorithms.
Professional Storytelling Tools
Leverage design tools for stunning visual content creation, inspired by Canva.
Dynamic Sharing Options
Easily share and export visual stories through links and embeds.
Scheduled Updates
Automate visual story updates to keep them aligned with real-time data.
Template Replication
Effortlessly replicate and share graph templates for quick collaboration.
Use Cases
Team Presentations
Enhance team presentations by visually engaging stakeholders with compelling data stories.
Client Reporting
Prepare insightful client reports that highlight key metrics and trends in a visually appealing format.
Data Analysis
Quickly analyze and visualize complex datasets to draw actionable insights.
Training Sessions
Use Columns Ai to create interactive training materials that effectively communicate concepts through visual stories.
Social Media Marketing
Craft stunning content for social media that captures attention and communicates data-driven insights.
Data-Driven Decision Making
Leverage real-time data visualizations to make informed decisions and strategic plans.
FAQs
Traffic(2025-03)
Monthly Traffic
Traffic Source
Top Keywords
| Keyword | Traffic | Volume | CPC |
|---|---|---|---|
| columns ai | 165 | 570 | 3.17 |
| clumns ai | 148 | 40 | - |
| columns is an ai data visualization platform | 141 | 20 | - |
| columns: ai tool to chat with data and turn it into visual stories | 121 | 30 | - |
| columm chart word cloud | 47 | - |
Source Region
Whois
| Domain | columns.ai |
| Creation Date | 2026-12-13 20:14:27 |
| Last Updated | 2025-01-21 17:07:43 |
| Domain Status | clientdeleteprohibited, clientrenewprohibited, clienttransferprohibited, clientupdateprohibited, //icann.org/epp |
| Registrar | 1API GmbH |
| Registrar IANA ID | 1387 |
| Registrar URL | http://www.1api.net |
| Registrant Organization | Domains By Proxy, LLC |
| Registrant State | Arizona |
| Registrant Country | US |
Featured Products
ExplodingTopics
ImageTranslateAI
Atlas
Scribewave
EndorsedAi
AudioNote
LastMileAI
Napkin
Related Categories
Copy embed code
Alternative Products

Mailgo

Acedit

Recallify

Prism

Blobfish AI

Frispeech

Helpedby AI