Basedash - Empower data-driven decisions effortlessly
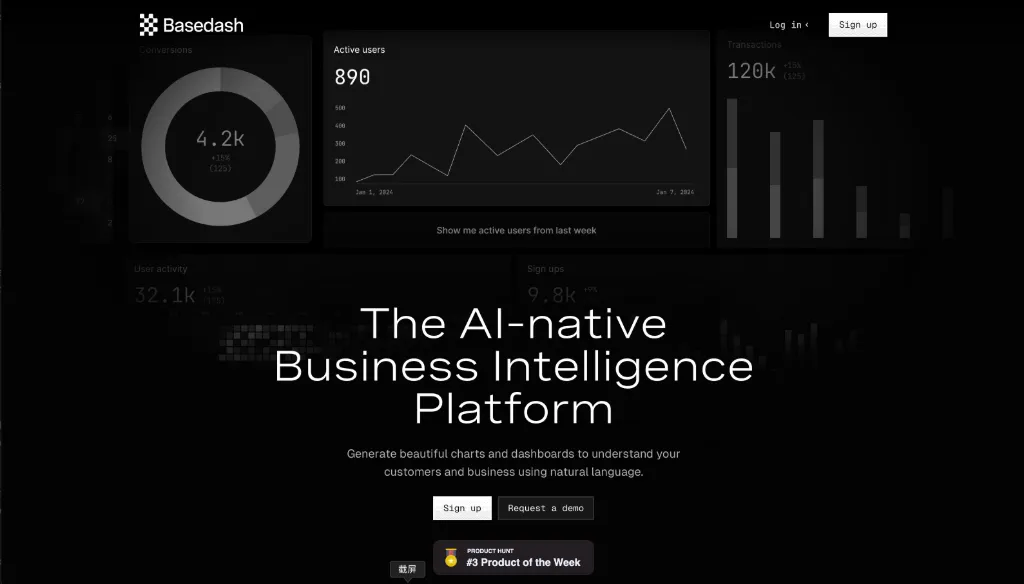
At the core of Basedash is a powerful AI that interprets natural language queries and translates them into visual data representations. With this intuitive approach, users can interact with their data without needing to know complex SQL syntax or database structures. Here’s how it works:
- Natural Language Processing: Users input their queries in plain English, and the AI parses the request.
- Context Awareness: Basedash uses custom context, including user-defined KPIs and jargon, to understand the specific needs of the user.
- Instant Visualization: The AI generates the appropriate chart or dashboard based on the data retrieved from the connected database.
- Error Correction: If the AI misinterprets a query, it can auto-correct and refine the request to ensure accurate results.
- Seamless Integration: Users can easily connect their databases, allowing for real-time data access without performance issues.
To get started with Basedash, follow these steps:
- Sign Up: Create an account on the Basedash website.
- Connect Your Database: Use the direct database connection feature to link your data warehouse.
- Input Your Query: Type your query in natural language, specifying what data visualization you want.
- Receive Visualizations: Basedash will generate the chart or dashboard based on your input.
- Customize: Adjust the visualizations by refining your queries or changing parameters.
- Share Insights: Use the generated dashboards to share insights with your team and make data-driven decisions.
Basedash revolutionizes the way businesses interact with their data by making data visualization accessible to everyone, regardless of technical expertise. With its AI-powered capabilities, users can create stunning dashboards in minutes, ensuring that insights are always at their fingertips. Whether you're in marketing, sales, finance, or operations, Basedash empowers your team to make informed decisions quickly and efficiently. Experience the future of business intelligence with Basedash today.
Features
Natural Language Queries
Easily generate charts and dashboards using simple natural language, making data visualization accessible to everyone.
AI-Powered Insights
Utilize AI to understand complex queries and generate accurate visualizations quickly.
Error Correction
Automatically corrects misunderstandings in queries to ensure accurate data representation.
Custom Contextual Understanding
Learn and adapt to your specific business terminology and KPIs for more relevant insights.
Direct Database Connection
Seamlessly connect your data warehouse for real-time data access without impacting production performance.
User-Friendly Interface
Navigate and explore your data with an intuitive interface that resembles a spreadsheet.
Use Cases
Sales Reporting
Create sales performance dashboards to track monthly revenue, new customers, and sales trends.
Marketing Analytics
Visualize campaign performance across multiple channels to optimize marketing strategies.
Product Performance Monitoring
Analyze product usage data to understand customer engagement and retention.
Financial Reporting
Generate financial reports to track expenditures, revenues, and profitability.
Customer Support Analysis
Monitor ticket resolution times and customer satisfaction ratings to improve service quality.
Operational Efficiency Tracking
Identify bottlenecks in processes by visualizing operational metrics.
FAQs
Traffic(2025-04)
Monthly Traffic
Traffic Source
Top Keywords
| Keyword | Traffic | Volume | CPC |
|---|---|---|---|
| basedash | 3159 | 3280 | - |
| how to insert a character in a string javascript 5 to last character | 1451 | - | |
| base dash | 383 | 110 | - |
| ai yc application writer | 378 | 30 | - |
| basedash charts | 314 | 40 | - |
Source Region
Whois
| Domain | basedash.com |
| Creation Date | 2025-07-13 19:54:25 |
| Last Updated | 2024-06-13 06:01:54 |
| Domain Status | clienttransferprohibited, //icann.org/epp |
| Registrar | NameCheap, Inc. |
| Registrar IANA ID | 1068 |
| Registrar URL | http://www.namecheap.com |
Featured Products
Atlas
Napkin
Eraser
Storydoc
Rosebud
Publer
GptExcel
Reclaim Ai
Related Categories
Copy embed code
Alternative Products
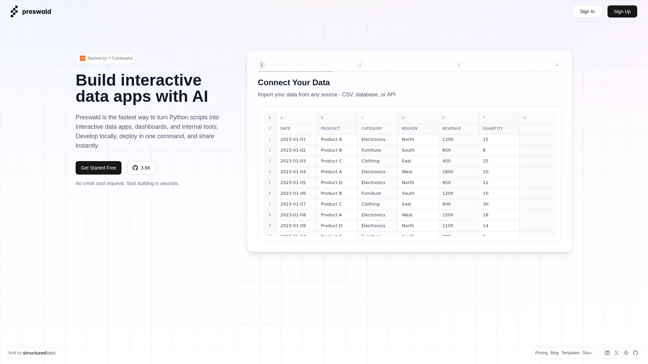

Preswald


Patra
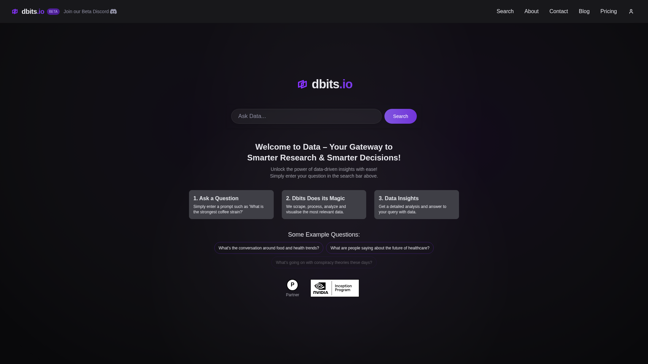

dbits.io-gXkzofjU9C

Alpaca Chat

HyperArc

Nelly


Product Map