Rows - Transform data into insights effortlessly
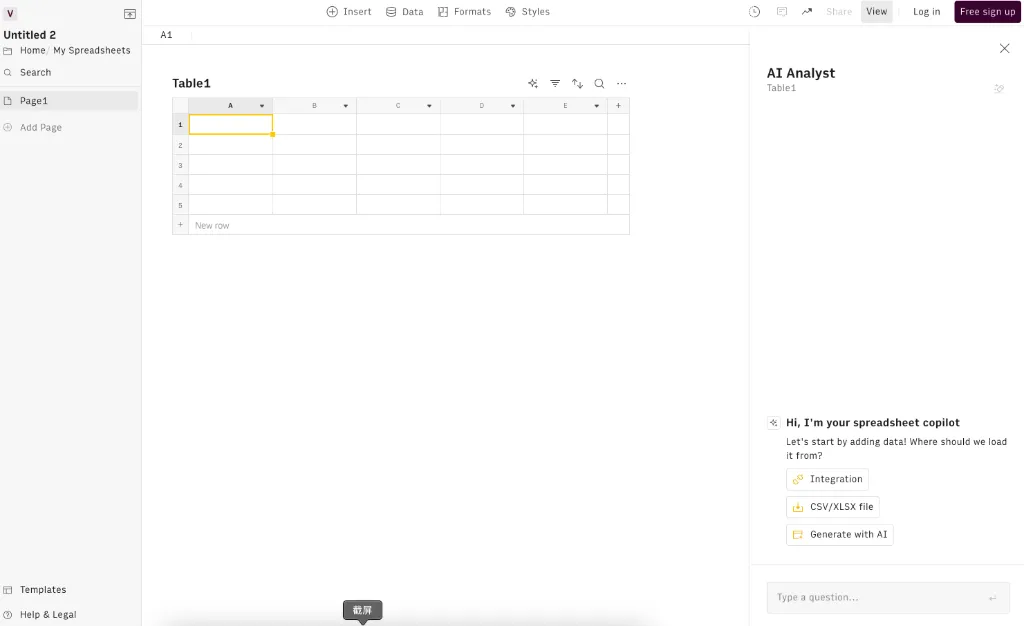
Rows operates on a straightforward principle of data integration and analysis. It allows users to import data from various platforms and formats, transforming it into a unified view for easier analysis. The key functionalities include:
- Data Import: Effortlessly import data from CSV, XLSX, Notion, Facebook Ads, Instagram, Bank Accounts, and Google Analytics 4.
- Data Manipulation: Utilize a variety of functions to clean, filter, and manipulate your data as needed.
- Collaboration: Work collaboratively with team members in real-time, sharing insights and data easily.
- Visualizations: Create compelling visualizations to represent your data clearly and effectively.
- Integrations: Connect with other tools to automate workflows and enhance efficiency.
- User-Friendly Interface: Designed for users of all levels, making data analysis accessible to everyone.
To get started with Rows, follow these simple steps:
- Create an Account: Sign up for a free Rows account on the website.
- Choose Your Data Source: Select the source from which you want to import data, such as CSV or Google Analytics.
- Import Data: Follow the prompts to upload your data or connect your accounts.
- Analyze Your Data: Use Rows' tools to clean, manipulate, and analyze your data.
- Visualize Insights: Create charts and graphs to visualize your findings.
- Collaborate: Share your Rows sheets with team members for collaborative analysis.
In conclusion, Rows is an invaluable tool for anyone looking to streamline their data management and analysis processes. With its ability to import data from various sources and transform it into actionable insights, Rows empowers users to make data-driven decisions effortlessly. Whether you are handling marketing data, financial records, or any other type of information, Rows simplifies the complexities of data analysis, enabling you to focus on what matters most—turning insights into action.
Features
Multiple Data Imports
Import data from various sources like CSV, Notion, and Google Analytics seamlessly.
User-Friendly Interface
Designed for users of all skill levels, making data analysis accessible.
Real-Time Collaboration
Work together with team members in real-time to analyze and share insights.
Powerful Data Manipulation Tools
Clean and filter your data easily with built-in functions.
Visual Data Representation
Create charts and graphs to visualize your data effectively.
Integrations with Other Tools
Connect Rows with your favorite tools to automate workflows.
Use Cases
Marketing Analysis
Use Rows to analyze marketing campaigns by importing data from Facebook Ads and Google Analytics.
Financial Reporting
Import bank account data and generate financial reports effortlessly.
Project Management
Collaborate with your team by importing project data from Notion and tracking progress.
E-commerce Insights
Analyze sales data from various sources to optimize your e-commerce strategy.
Data Visualization
Create visualizations to present complex data in an understandable format.
Social Media Monitoring
Import data from Instagram to track engagement metrics and performance.
FAQs
Traffic(2025-03)
Monthly Traffic
Traffic Source
Top Keywords
| Keyword | Traffic | Volume | CPC |
|---|---|---|---|
| rows | 12089 | 87850 | 1.28 |
| rows ai | 3481 | 10110 | 5.79 |
| json to table | 1098 | 13120 | 1.85 |
| row ai | 655 | 1180 | - |
| rows com | 615 | 720 | - |
Source Region
Whois
| Domain | rows.com |
| Creation Date | 2025-03-04 05:00:00 |
| Last Updated | 2024-03-05 10:38:59 |
| Domain Status | clientdeleteprohibited, clientrenewprohibited, clienttransferprohibited, clientupdateprohibited, //icann.org/epp |
| Registrar | GoDaddy.com, LLC |
| Registrar IANA ID | 146 |
| Registrar URL | http://www.godaddy.com |
Featured Products
ExplodingTopics
Scribewave
EndorsedAi
LastMileAI
TubeBuddy
Glide
Supernormal
Roast Dating
Related Categories
Copy embed code
Alternative Products

Mailgo


Deeptrue


Recallify


Prism

UpRate


Blobfish AI

Helpedby AI